Skip to content
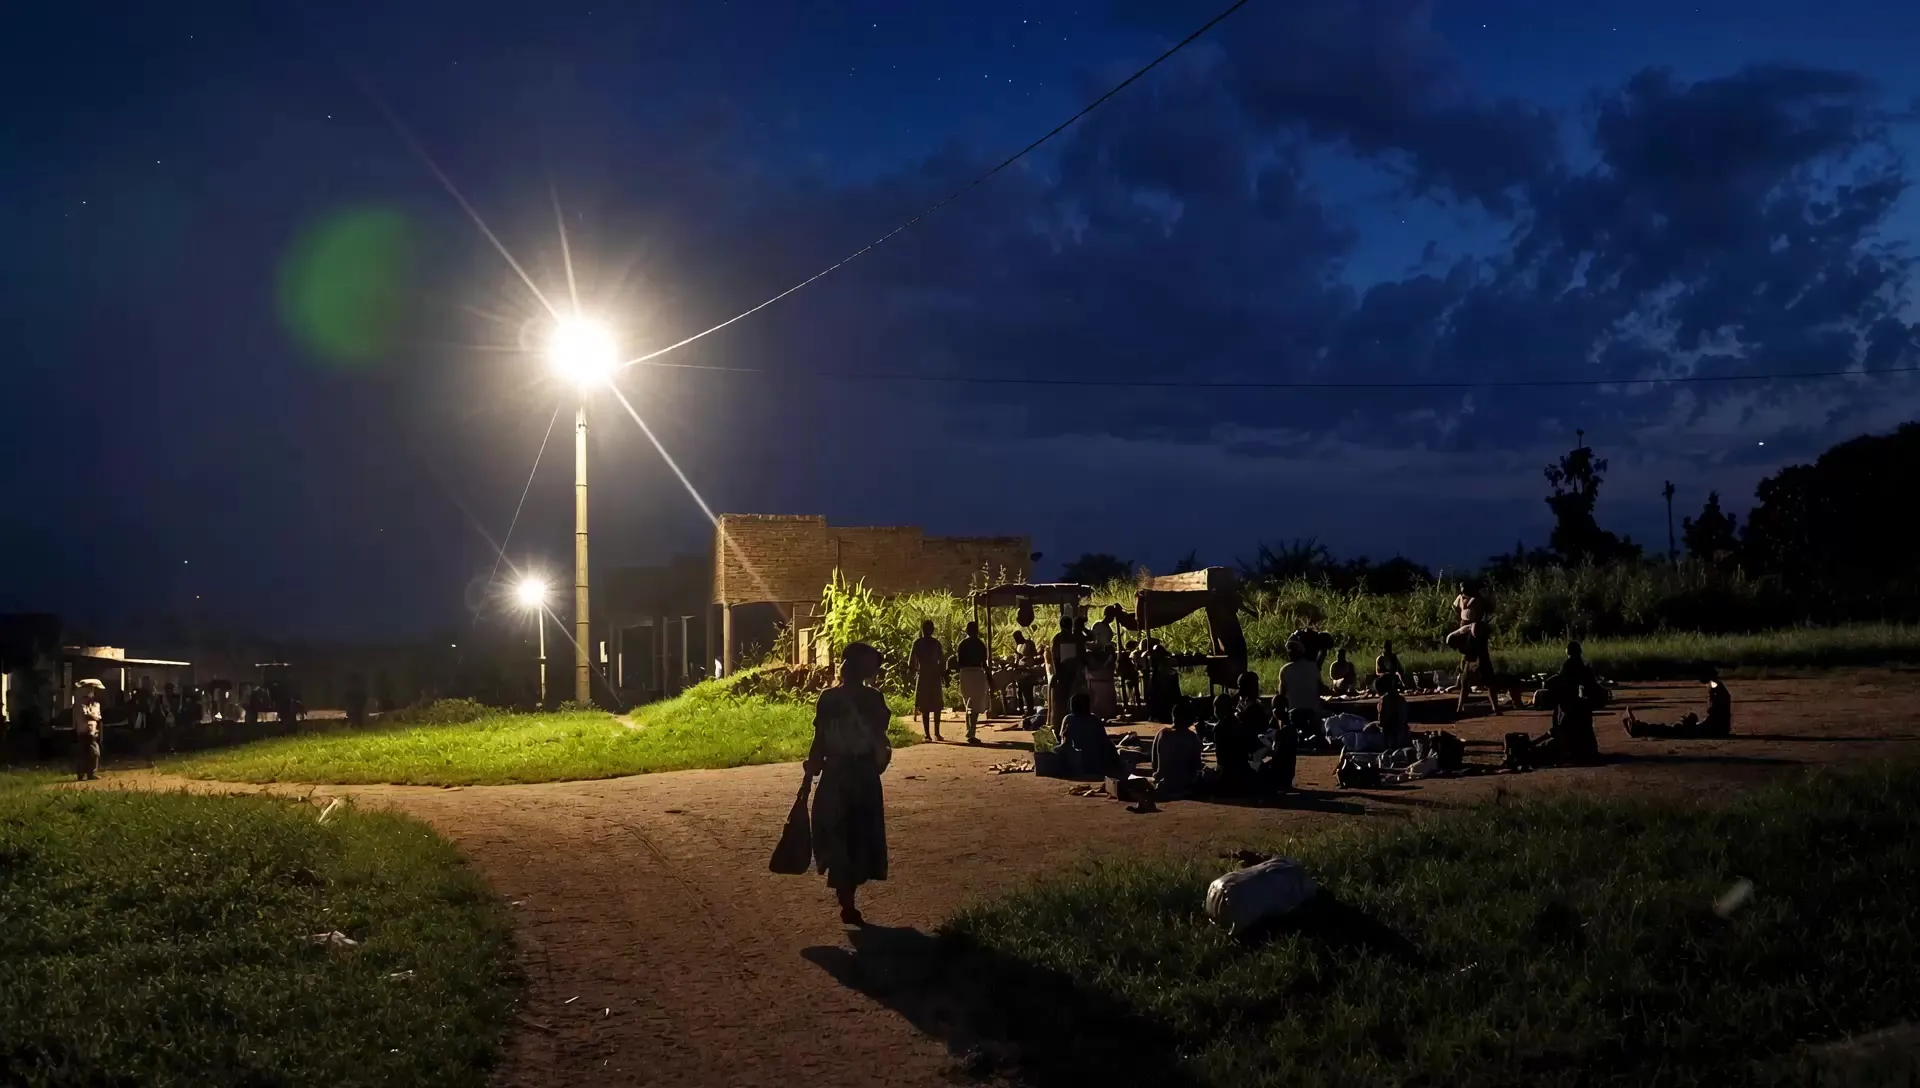
A village street lit after dark by a street light on the Got Ngur mini grid
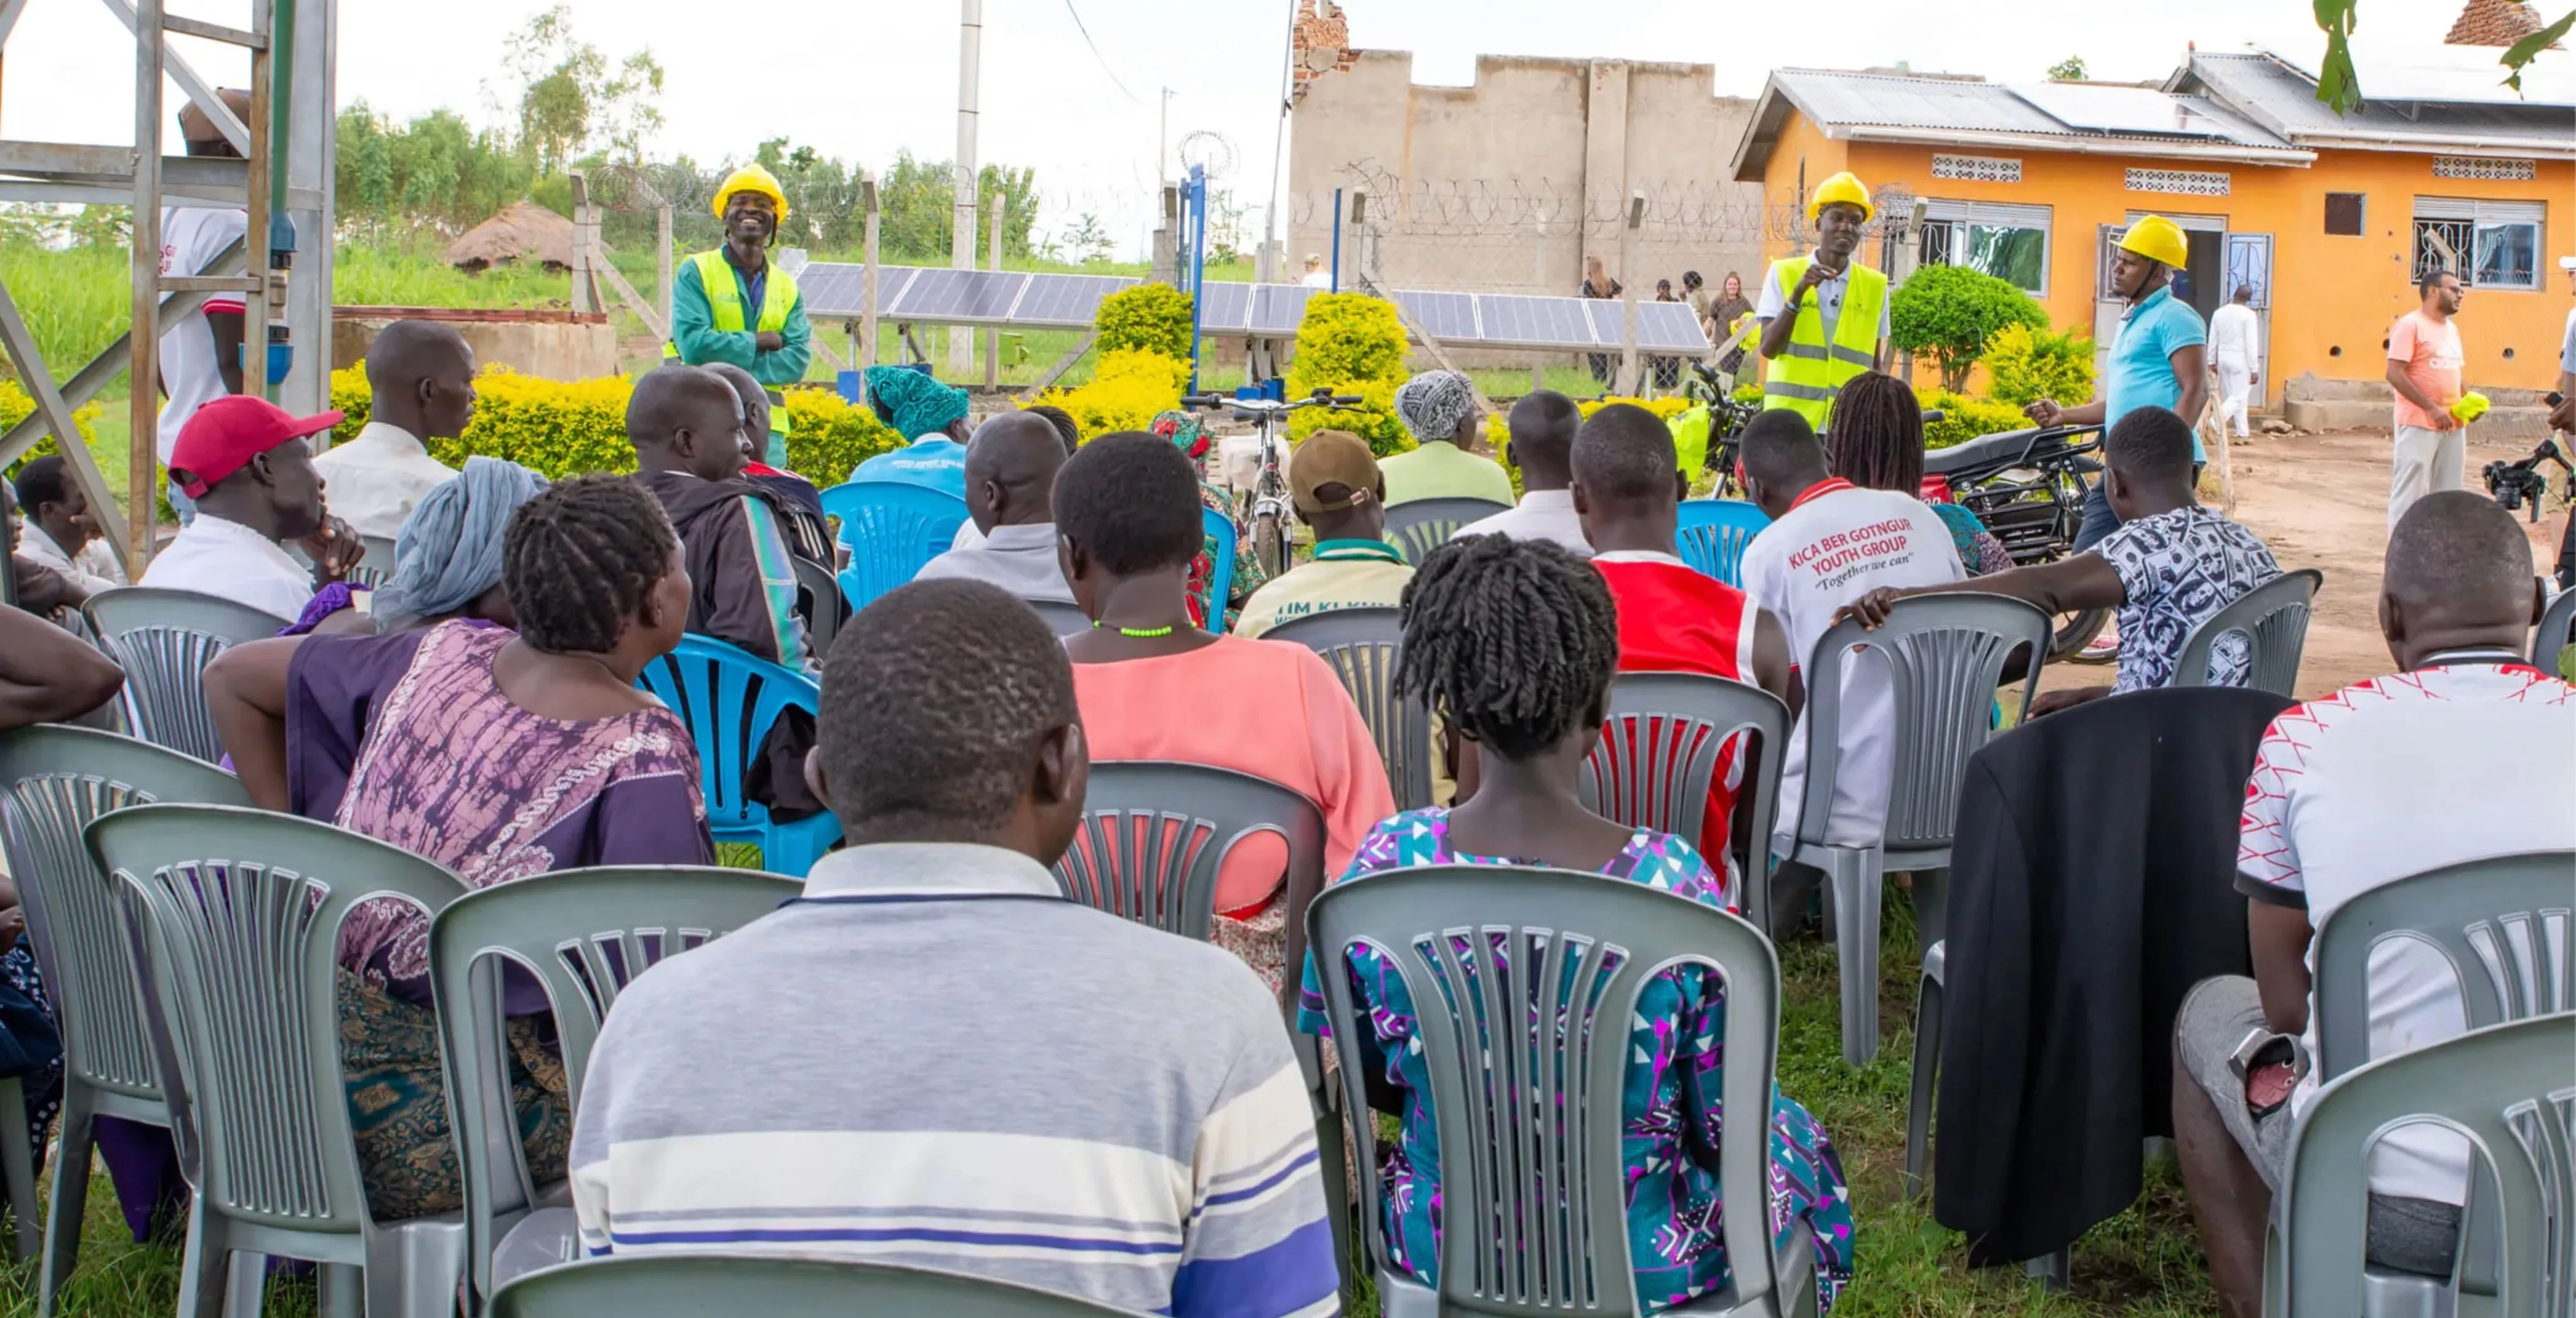
A seated community meeting at Got Ngur, addressed by Mandulis Energy staff

Impact

See what your
credits actually do.

Move one slider. Every figure below recalculates against our project design figures and published Ugandan statistics.

Impact calculator

How many credits are you buying?

Everything below this control updates as you move it. The minimum purchase is 15,000 credits.

You buy

15,000credits

One credit is one tonne of CO2e removed and stored. Minimum 15,000.

Carbon removed and stored

15,000 tonnes CO2e

Durable biochar. Stored for 100 to 1,000 years.

  1. 2026100
  2. 20273,200
  3. 20283,900
  4. 20293,900
  5. 20303,900

Children with electric light to study by

690

In the peak year. Across the whole period, 180 to 890 children. Based on Uganda Census 2024 household size and school attendance.

Each mark represents 20 children.

Household connections your purchase supports

1,100

In the peak year. A proportional share of each site, not a claim that these connections would not otherwise exist.

Each mark represents 20 households.

Equivalent to the carbon held by

42,000 mature trees

An equivalence used to convey scale, not a count of trees planted or saved. Range 22,000 to 97,000 trees.

Each mark represents 700 trees.

Delivered from

5 projects

Taking 5 years, from 2026 to 2030.

  • Northern Uganda Mini Grid and Carbon Removal Project38 %
  • Remaining rural mini-grid pipeline21 %
  • Bungu Mini Grid20 %
  • Got Ngur Mini Grid (scale up)19 %
  • Got Ngur Mini Grid (pilot)2 %

Fossil emissions avoided, separately

33 to 78 tonnes CO2e

Small, and we will not pretend otherwise. Uganda's grid is close to 89 % hydro, so the honest counterfactual for an off-grid site is kerosene lamps and candles, not a fossil grid. This is never added to the removal figure above.

  • This purchase would take 57 percent of at least one project's annual issuance. Real projects sell to more than one buyer, so an allocation this concentrated is outside the range the model is meant to describe.
  • 98 percent of this purchase would come from projects that are not yet operating. Those volumes are design forecasts and depend on construction, verification and registry issuance.

This calculator is provided for educational and illustrative purposes only. Figures are modelled estimates, not guarantees. Actual outcomes may vary materially. Nothing here is an offer to sell carbon credits, a forward purchase agreement, financial product advice or investment advice: it is not an offer to sell carbon credits or any other instrument. All carbon volumes are subject to project construction, independent validation and verification, registry listing, buffer pool deductions and final issuance. Carbon removal and emissions avoidance are distinct quantities and are never combined into a single headline number. Tree figures are equivalences used to illustrate scale, not counts of physical trees.

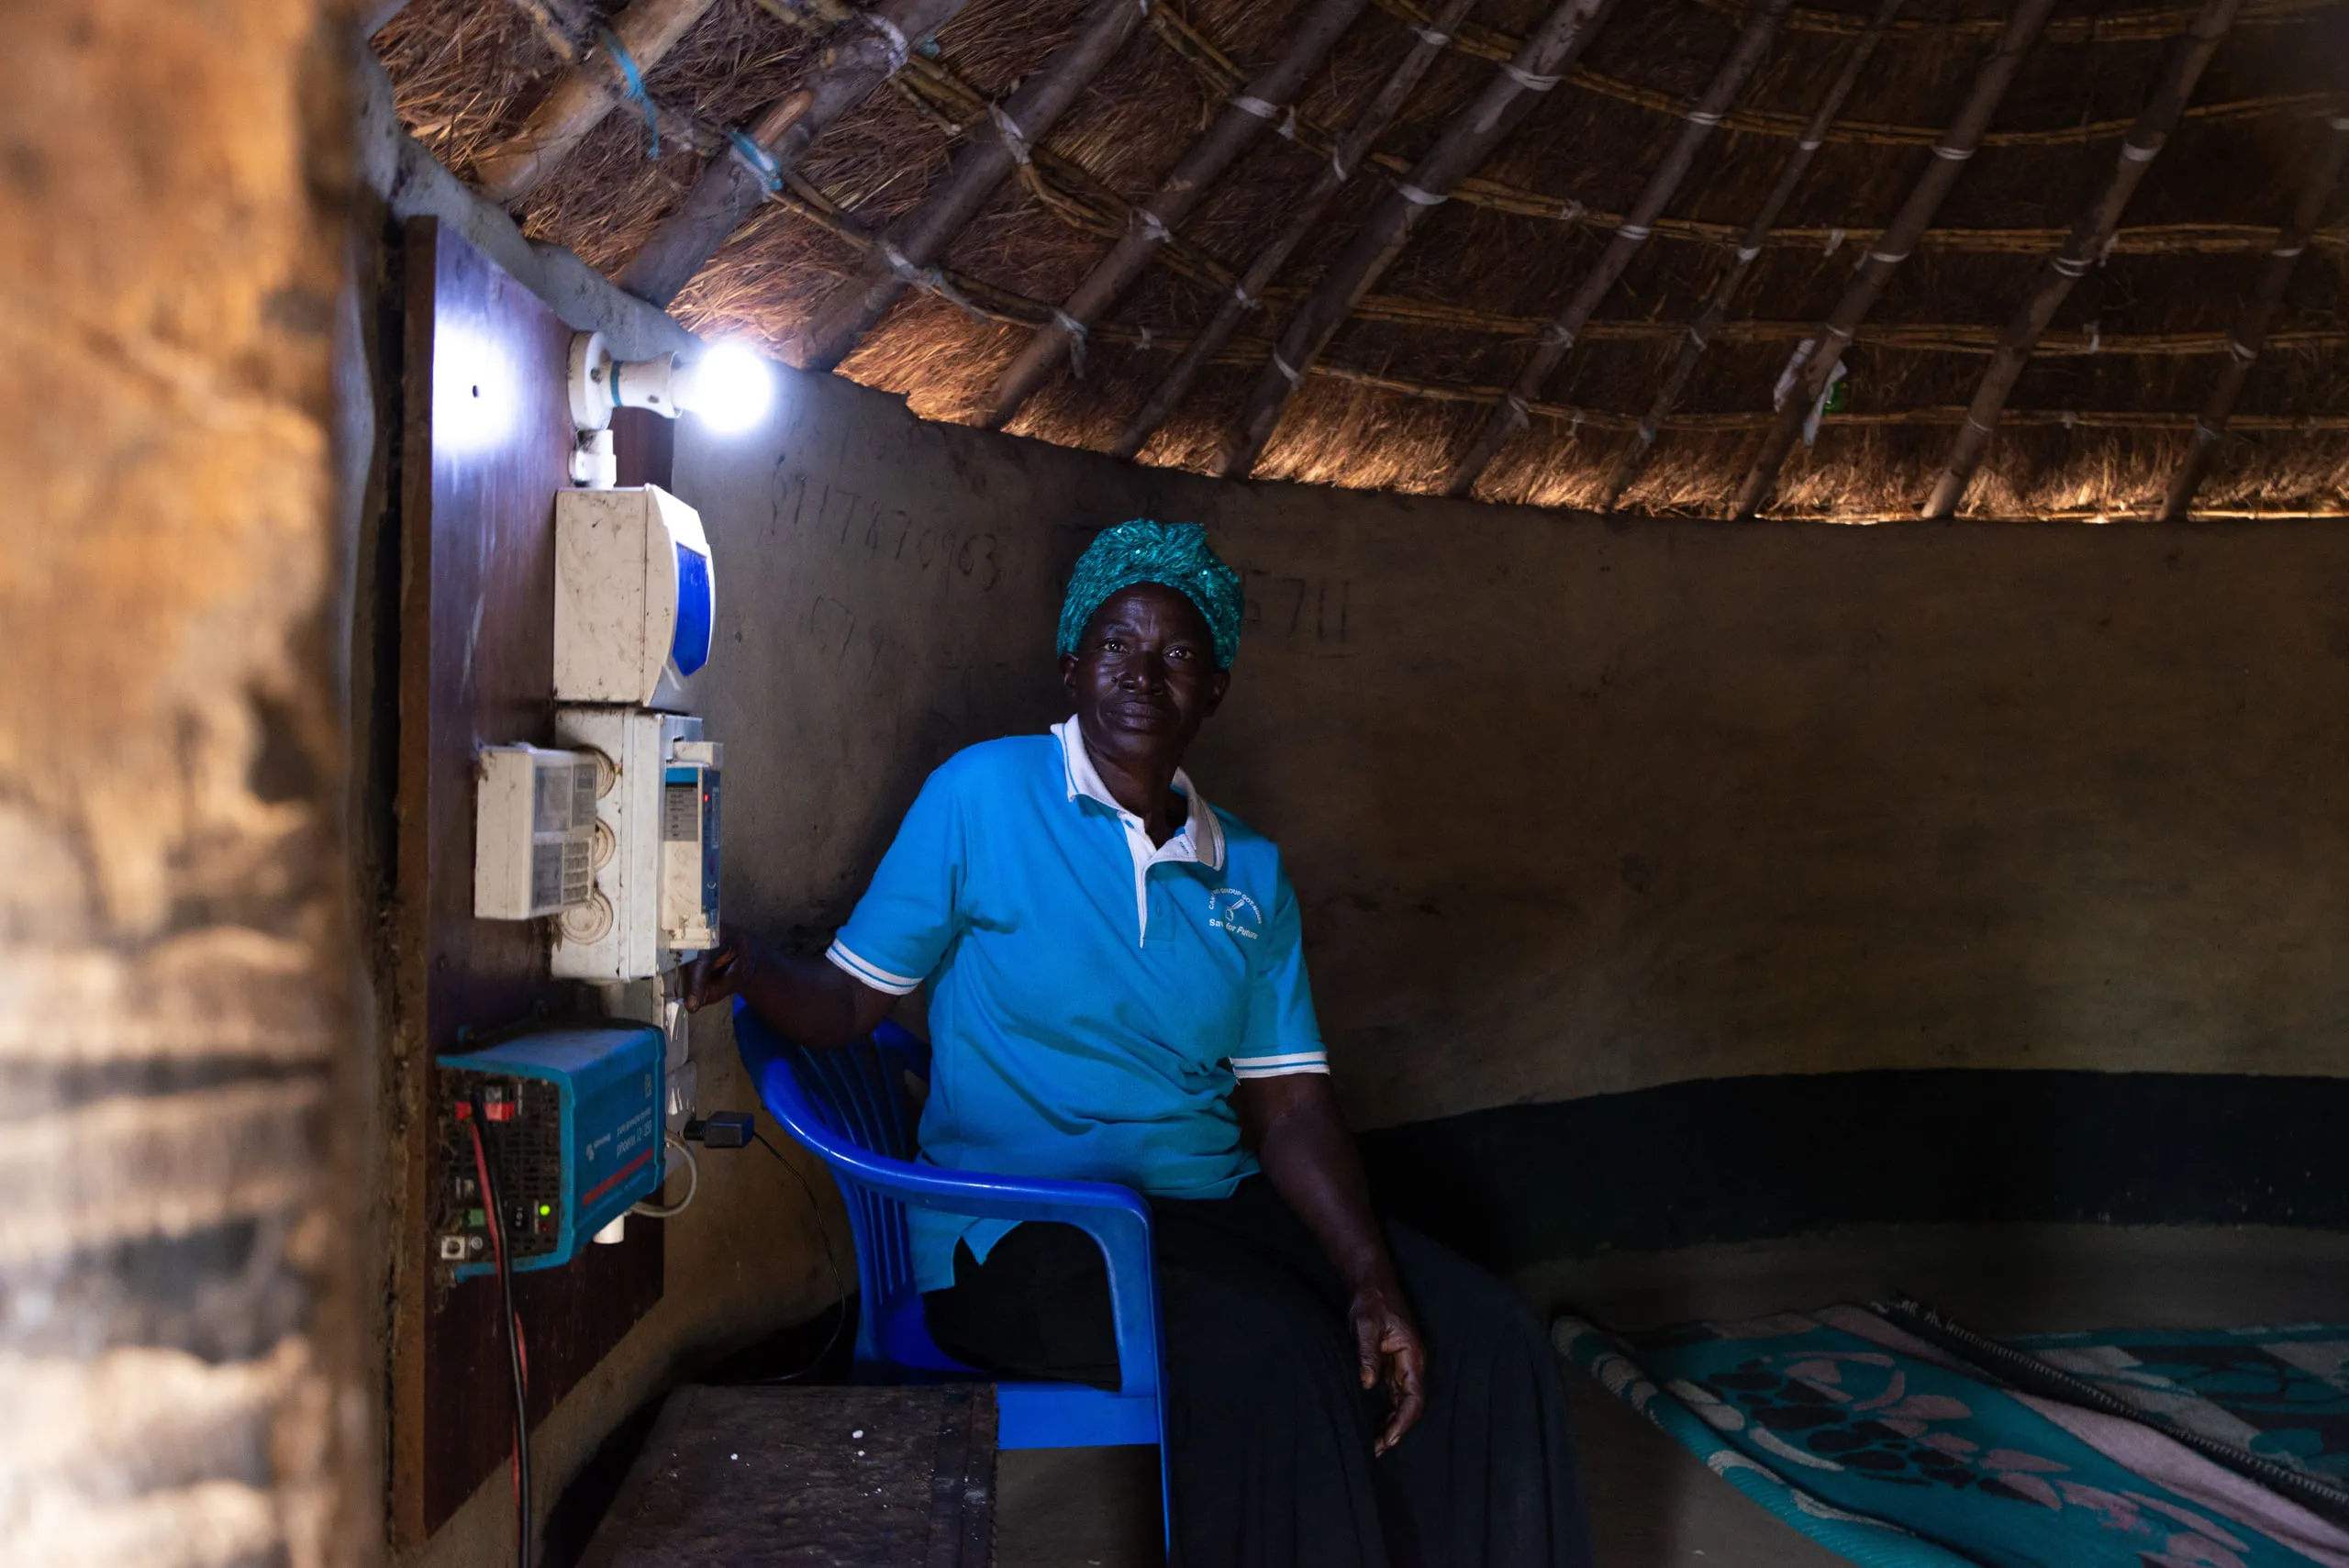
A customer inside her home, lit by electricity from the mini grid

People

approximately 1,100 households

household connections

Reliable electricity

Designed to deliver 24/7 clean electricity to 1,000+ households and 200+ businesses per 2.5 MW site. The operating pilot currently serves 118 connections.
A proportional share of connections, not a claim that these households would otherwise have no electricity. Averaged over the whole delivery period the figure is lower, at approximately 900 households, because the early years are limited by how much capacity is actually operating. The cumulative measure, which keeps rising however large the purchase, is approximately 4,500 household connection-years.

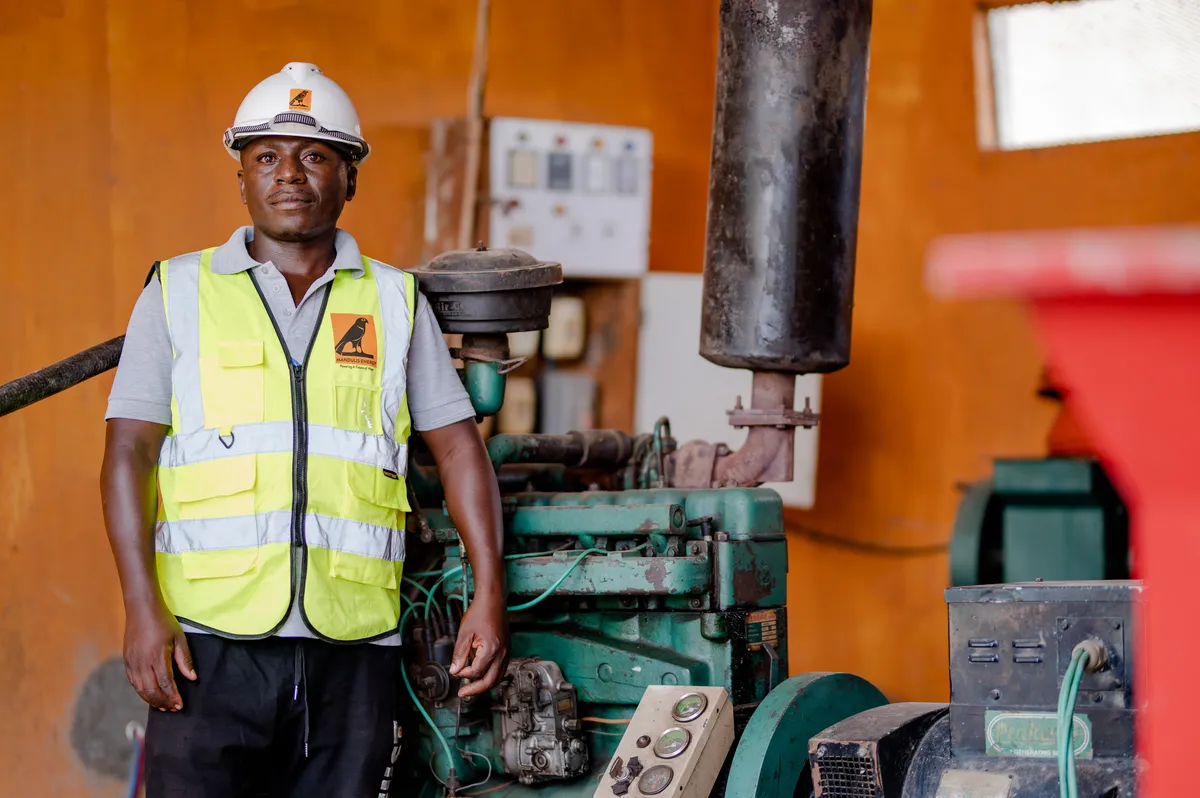
A Mandulis Energy technician at the generation hall

People

approximately 12 jobs

full-time jobs supported

Jobs and skills

Creating skilled local jobs in plant operations and feedstock supply logistics.
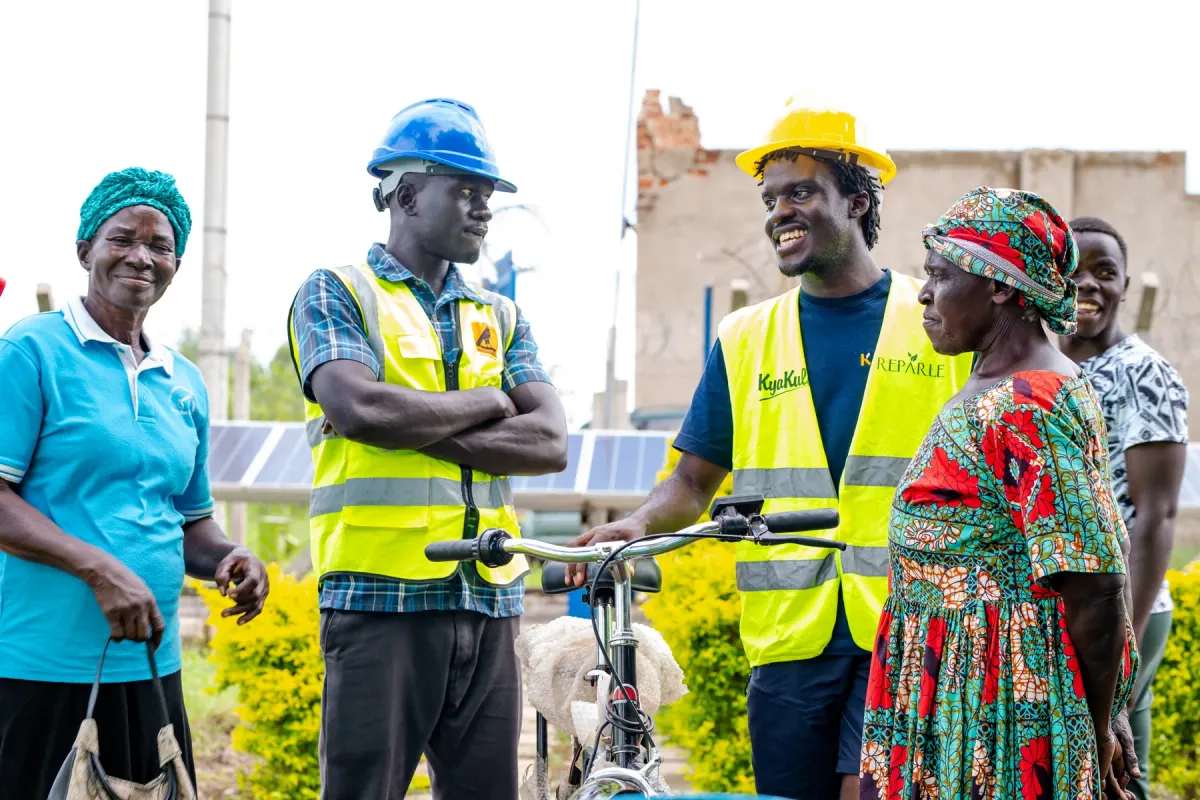
Range 4 to 12 jobs

The headline is the central estimate, not an upper bound: 4 jobs per MW counts direct and indirect employment, and the low end of the range applies 1.5 jobs per MW, which counts permanent plant operations and maintenance only. No upper coefficient is published, so read the range as a floor rather than a symmetric band. The employment factors are OECD and United States figures applied to a Ugandan project, which is an assumption rather than an observation. Mini-grid employment factors published for Uganda itself are expressed per MW deployed in a single year across a fleet of very small solar sites, and are deliberately not used: applied here they would imply roughly 210 jobs on one 2.5 MW plant. This is also a different measure from the "200 local jobs" cited in our project briefs. Those briefs attach a description to only one 200, where indirect income is said to accrue to more than 200 smallholder farmers and co-operative members supplying feedstock or applying biochar based fertiliser, and they leave direct construction and plant operations employment unquantified. Neither figure contains the other.

Members of the Got Ngur community at a project meeting

People

approximately 55,000 tonnes

biomass feedstock over the delivery period

Income opportunities

Unlocking new livelihoods for farmers and entrepreneurs through energy access and agricultural value addition.
A tonnage, not a count of livelihoods: no source gives the number of farmers or traders per tonne of feedstock, so no such count is published. The 4:1 ratio is the client published cookstove figure, and a power gasifier converts more of the feedstock to gas, so the real requirement per tonne of biochar is higher and this figure is a lower bound.

A sample of biochar drawn from the gasifier

Planet

15,000 tonnes CO2e

durable removal

Carbon removal

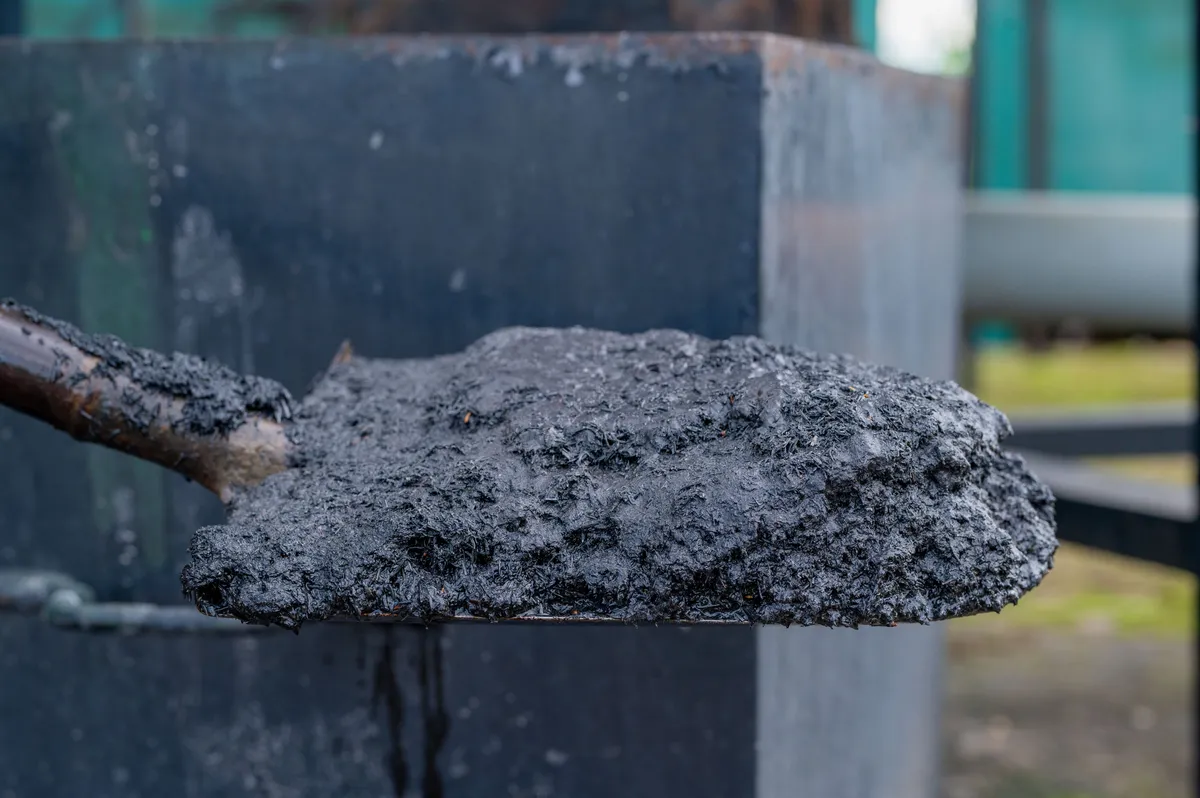
Removing and storing carbon for centuries through engineered biochar.
Durability is published as more than 100 years at 500 degrees Celsius and about 1,000 years at 1,100 degrees Celsius, and the model assumes no production temperature. This quantity is never added to the avoided emissions figure. Volumes remain subject to construction, verification, registry listing and buffer pool deductions.

Young crops growing in the field beside the ground-mounted solar array

Planet

approximately 920 hectares

cropland amended

Soil restoration

Improving soil fertility and water retention, increasing yields and reducing erosion.

Range 280 to 2,800 hectares

The area a given tonnage covers is set entirely by the application rate, and published trials report positive effects anywhere between 5 and 50 tonnes per hectare, so the range spans a factor of ten. It also assumes the attributed biochar goes to farmland rather than into construction materials, which the client also describes as an end use.

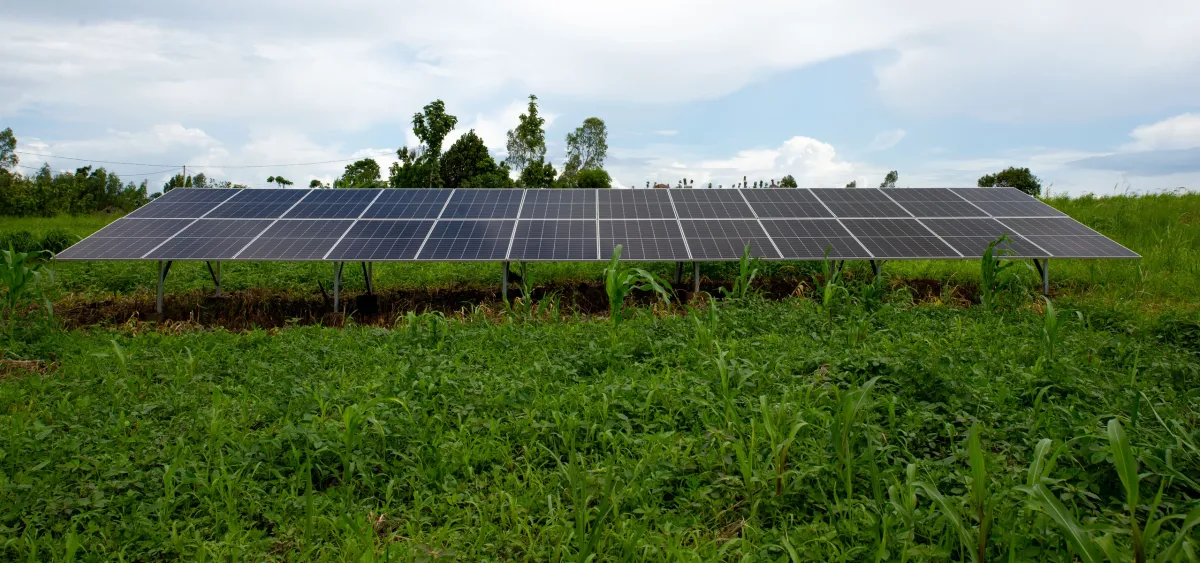
The solar photovoltaic array at the Got Ngur mini grid

Planet

approximately 39 tonnes CO2e

fossil emissions avoided

Reduced emissions

Avoiding diesel use and open burning while converting agricultural waste into clean energy and biochar.
Range 33 to 78 tonnes CO2e

Reported separately from the carbon removal and never added to it: it is roughly a quarter of one percent of the removal. Business and institutional self-generation, the open burning of agricultural residue and black carbon are all excluded because no defensible factor could be sourced for them, so this is a lower bound. Grid displacement is not claimed at all, because these are off-grid sites and the Ugandan grid is about 89 percent hydro.

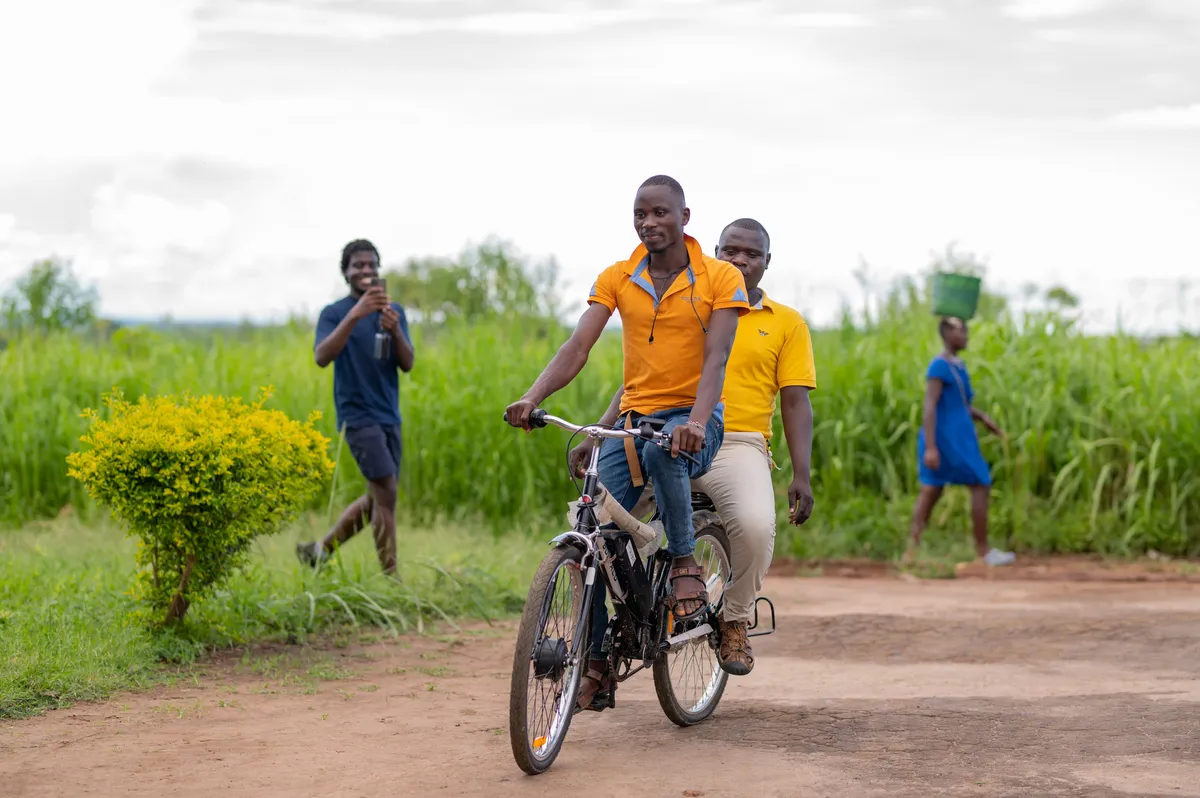
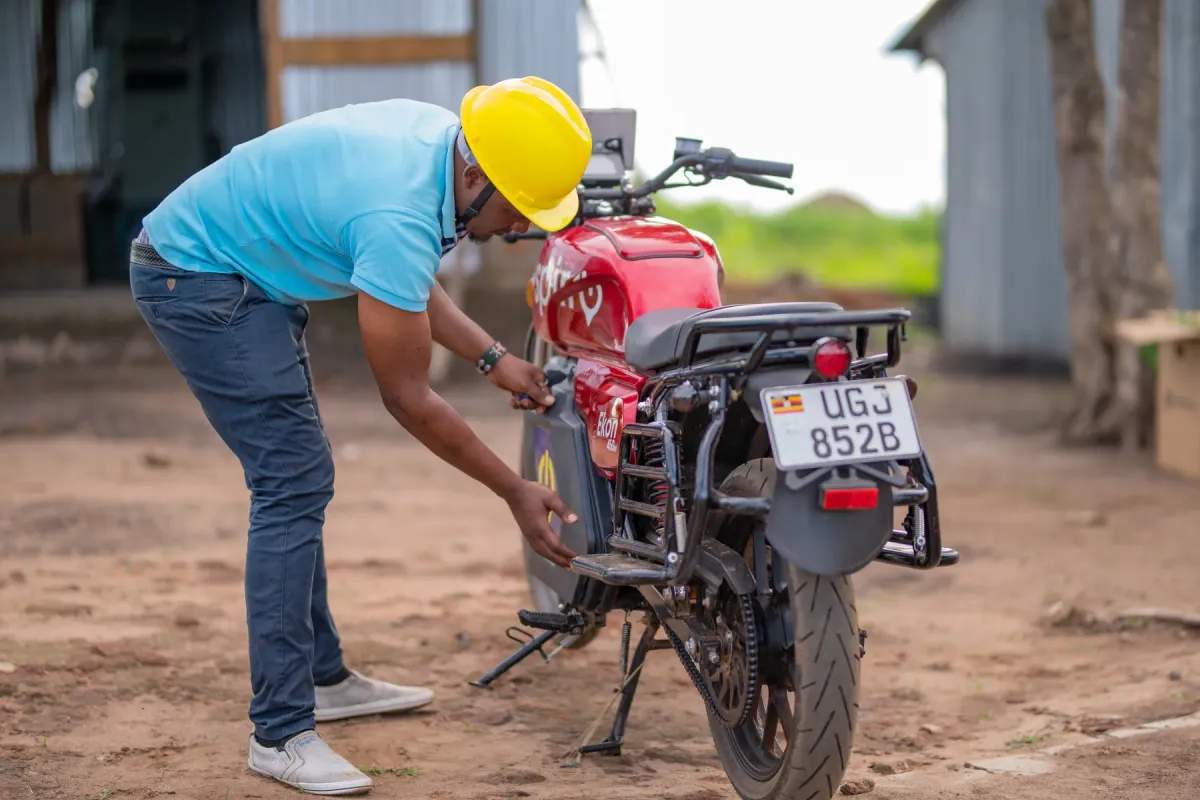
An electric bicycle charged from the mini grid in use on a village road

Prosperity

approximately 220 businesses

business connections

Productive businesses

Powering agro-processing, cold storage, workshops and service enterprises.
A connection count, not a count of enterprises created, and no claim is made about what those businesses do with the power. It rests on the published per site design basis of 200 or more businesses alongside 1,000 or more households, and the lower bound of each is the figure used.

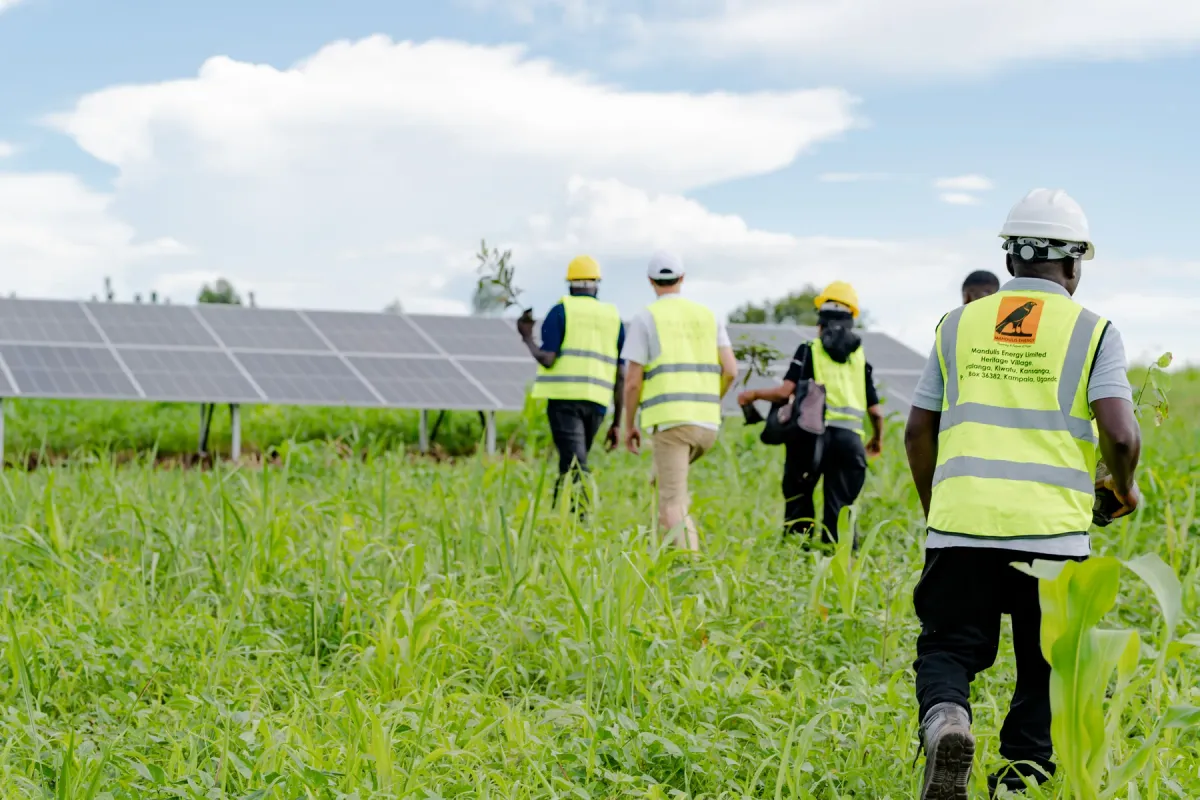
Staff walking a crop line through the tall grass beside the array

Prosperity

Not modelled

not modelled

Agricultural productivity

Biochar-enhanced soils and reliable irrigation leading to more dependable harvests.
A figure is coming, but it is not here yet, and the reason is worth stating plainly. The product is a biochar and bio-slurry fertiliser, blended 49 to 51, applied at roughly 147 to 196 kg per acre. That delivers about 0.18 to 0.24 tonnes of biochar per hectare. Trials reporting biochar yield gains apply more: the tropical mean in Jeffery et al. 2017 sits near a 15 tonne per hectare median, and even low-rate enriched-biochar trials start around 0.5 tonnes, still roughly two to three times this dose. So a biochar yield response cannot be read across from that literature. The fertiliser side is the more relevant channel, because the baseline here is little or no fertiliser use and Ugandan trials report large maize responses to nitrogen, but the blend has not yet been through laboratory analysis. Until it has, the 49 to 51 ratio is a formulation constraint, not evidence of fertiliser value, and no nutrient claim can be made from it. There is also a land ceiling: the area treated scales with the purchase, and this model's own 15,000 credit minimum would already imply more maize land than the Acholi sub-region has. Controlled trials on the actual product are being established, and those results, at the rate actually applied and against an untreated control, are what will replace this note. The hectares under Soil restoration remain the honest measure of scale until then.

Mandulis Energy staff with community members at Got Ngur

Prosperity

approximately 2,900 kW

installed clean generation capacity

Local economic growth

Strengthening value chains, powering rural industry, increasing incomes and expanding sustainable rural economies.
Installed capacity, not income. No income multiplier, value chain or gross value added coefficient for rural mini grids in Uganda could be sourced, so none is published. Capacity is what the purchase underwrites; what a local economy does with it is not modelled here.

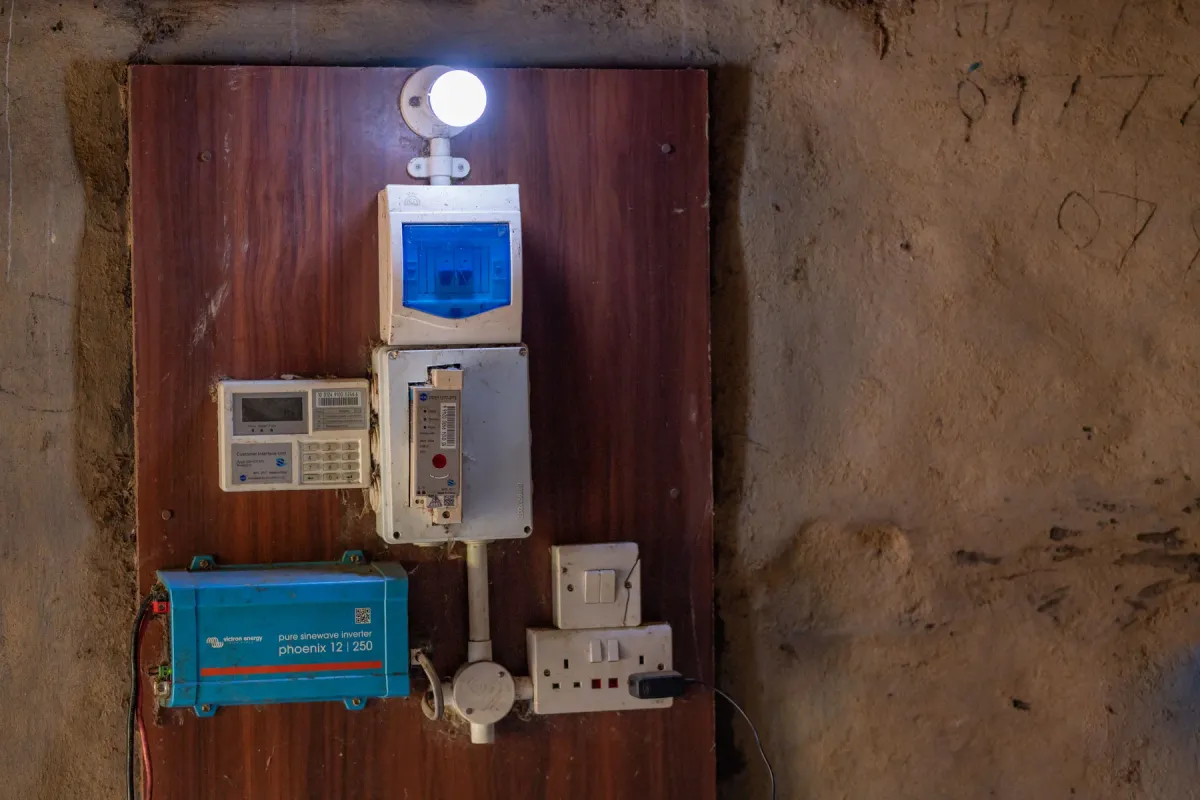
Electric light and a metered connection inside a customer home
An evening that used to end at sunset now runs on a meter.

Delivered, not modelled

What the pilot has already produced.

Everything above is an estimate. These are operating results from Got Ngur.

350+

Tonnes of biochar produced

Since project inception

350+

Tonnes of CO2e removed

Since project inception. 100 tonnes CO2e a year over 3.5 operating years, under the Rainbow methodology. All removal, no avoidance.

Partner with us

Turn a purchase into infrastructure.

Talk to us about carbon removal offtake, project development or investment.